

Turn nature complexity
into business clarity
How it works

Step 1. Map Your Nature Footprint
Easily upload locations, suppliers, or portfolios. Understand your interactions with critical ecosystems and natural resources globally.

Step 3. Accelerate Your Transition
Implement your sustainability strategy seamlessly, track progress, and report confidently with intuitive dashboards.
Step 2. Generate Strategic Insights
Advanced analytics pinpoint operational risks and highlight where regenerative practices create business efficiencies and financial opportunities.
Step 4. Share Your Progress
Generate disclosure-ready reports aligned with TNFD, CSRD, and other global frameworks. Demonstrate your nature-positive journey to stakeholders with confidence.
Not sure where to start?
Download our free guide for measuring, managing, and reporting nature risk, in five actionable steps.

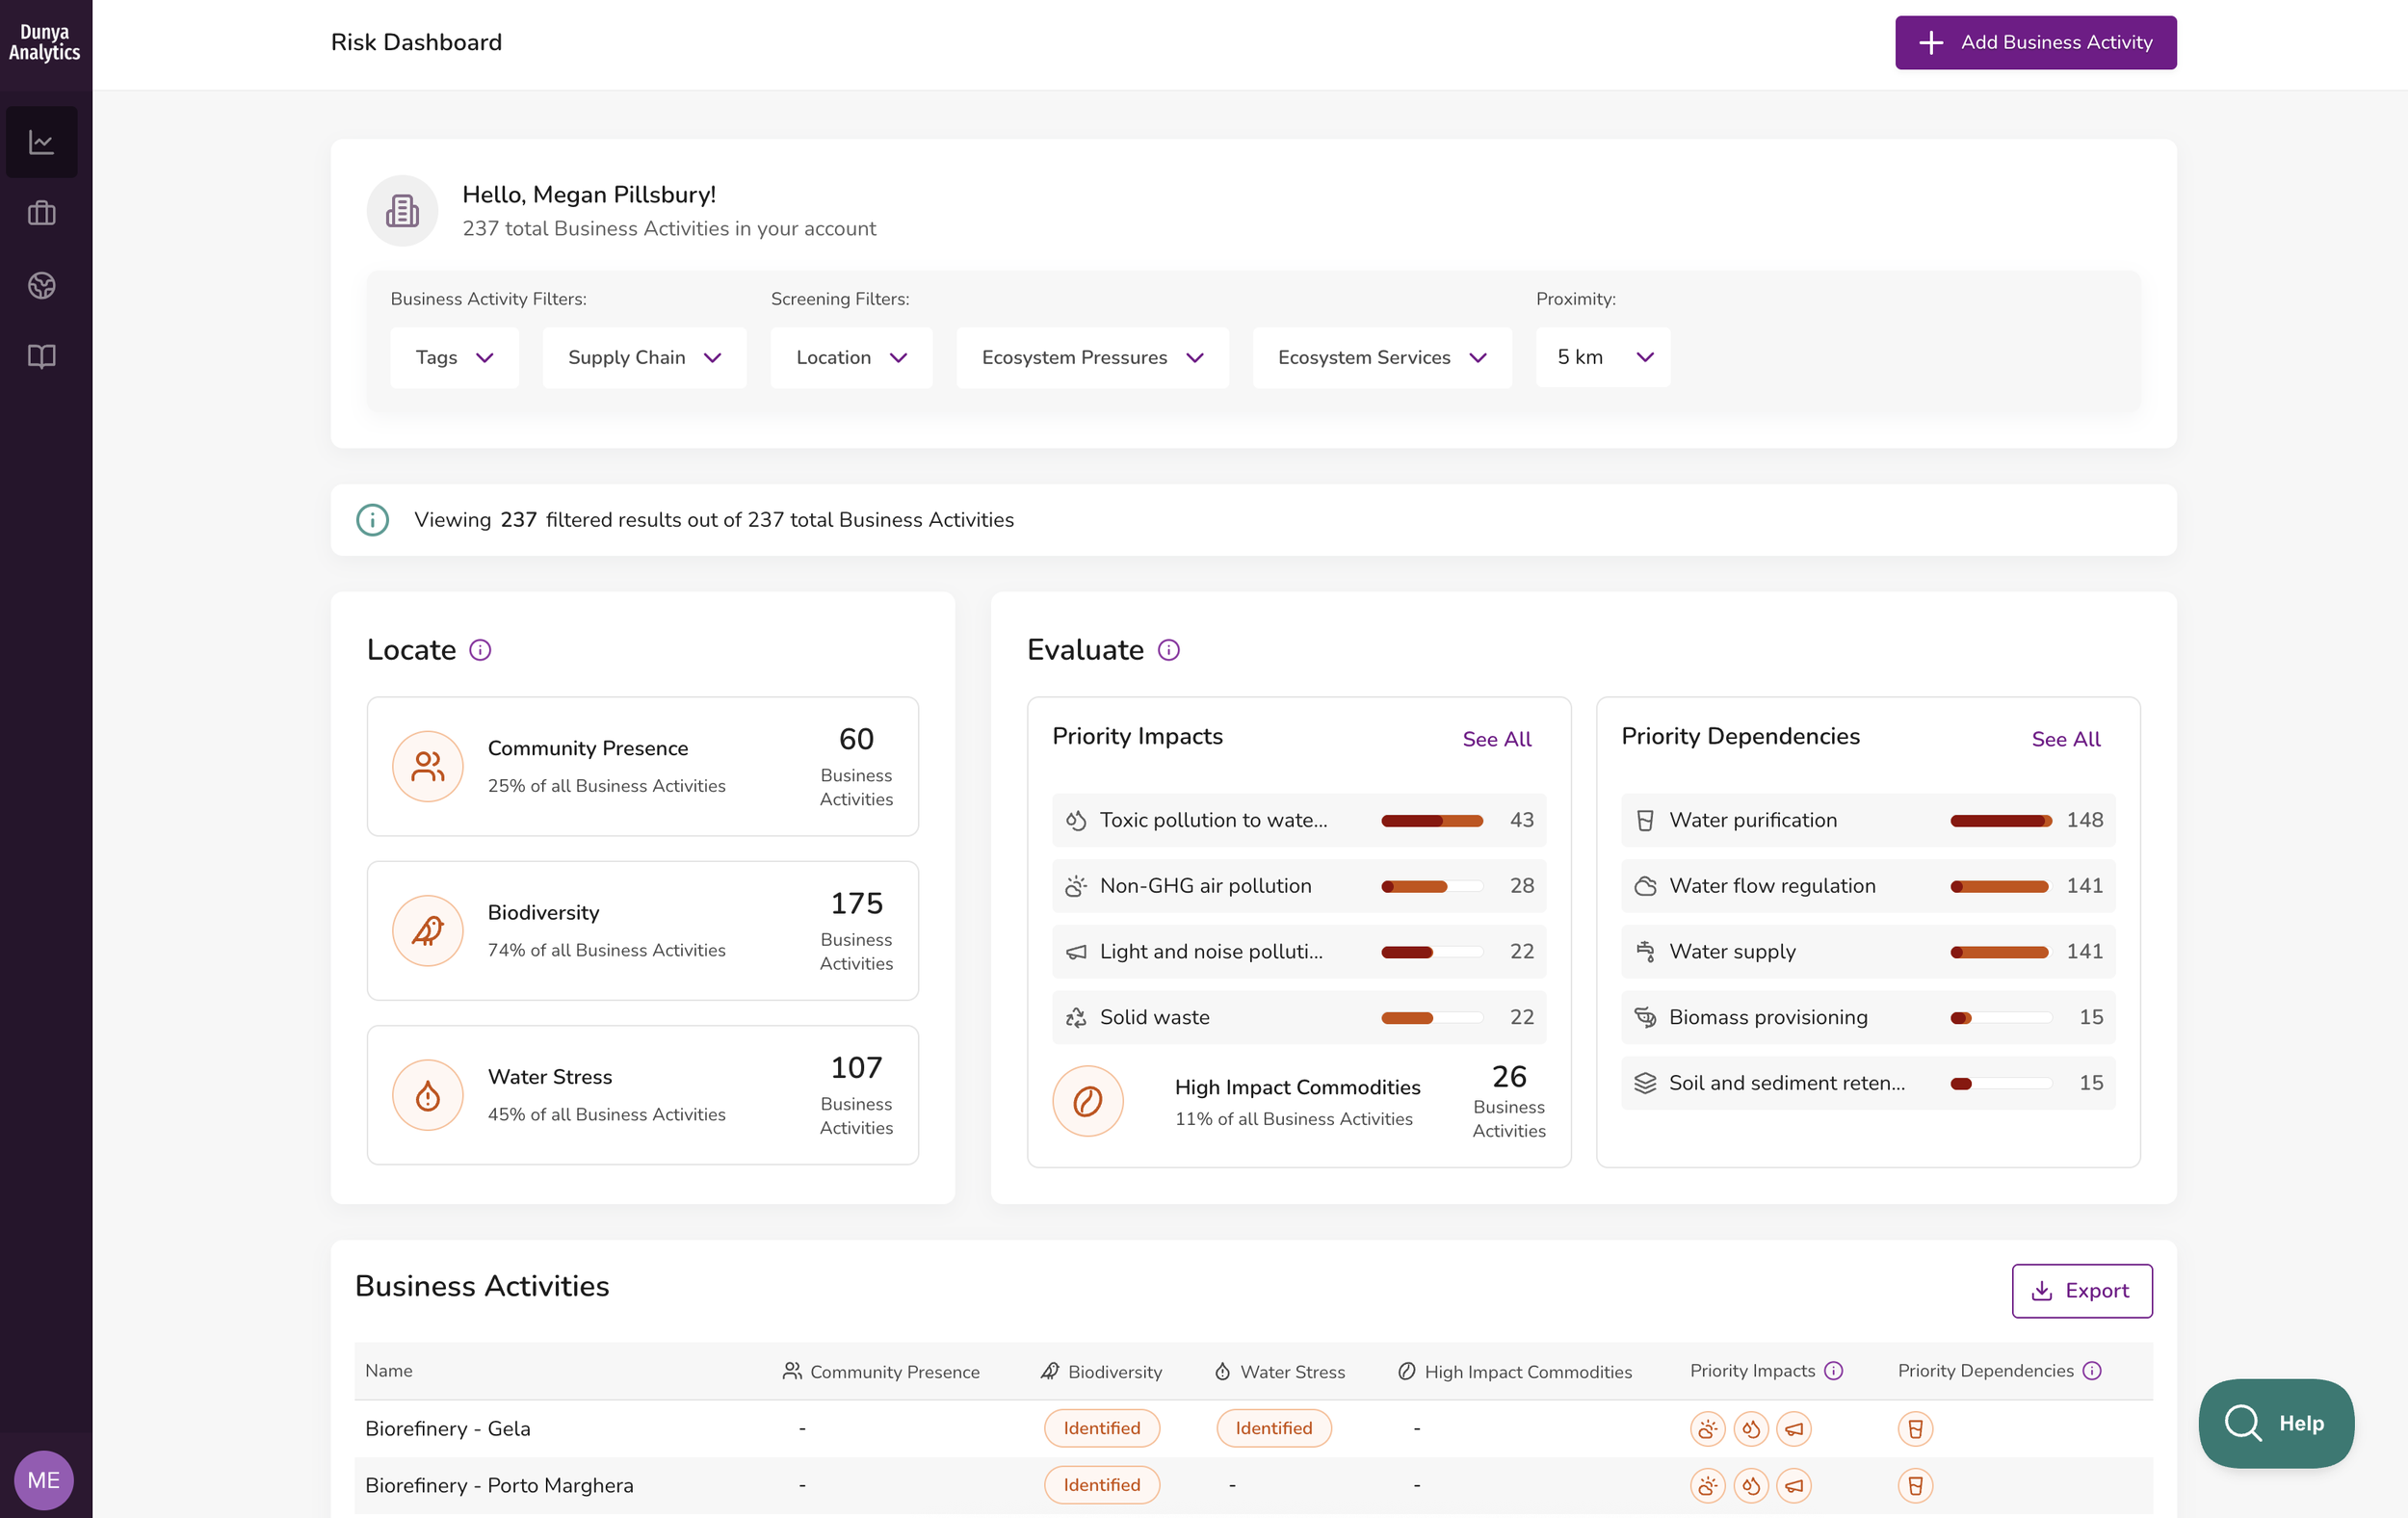
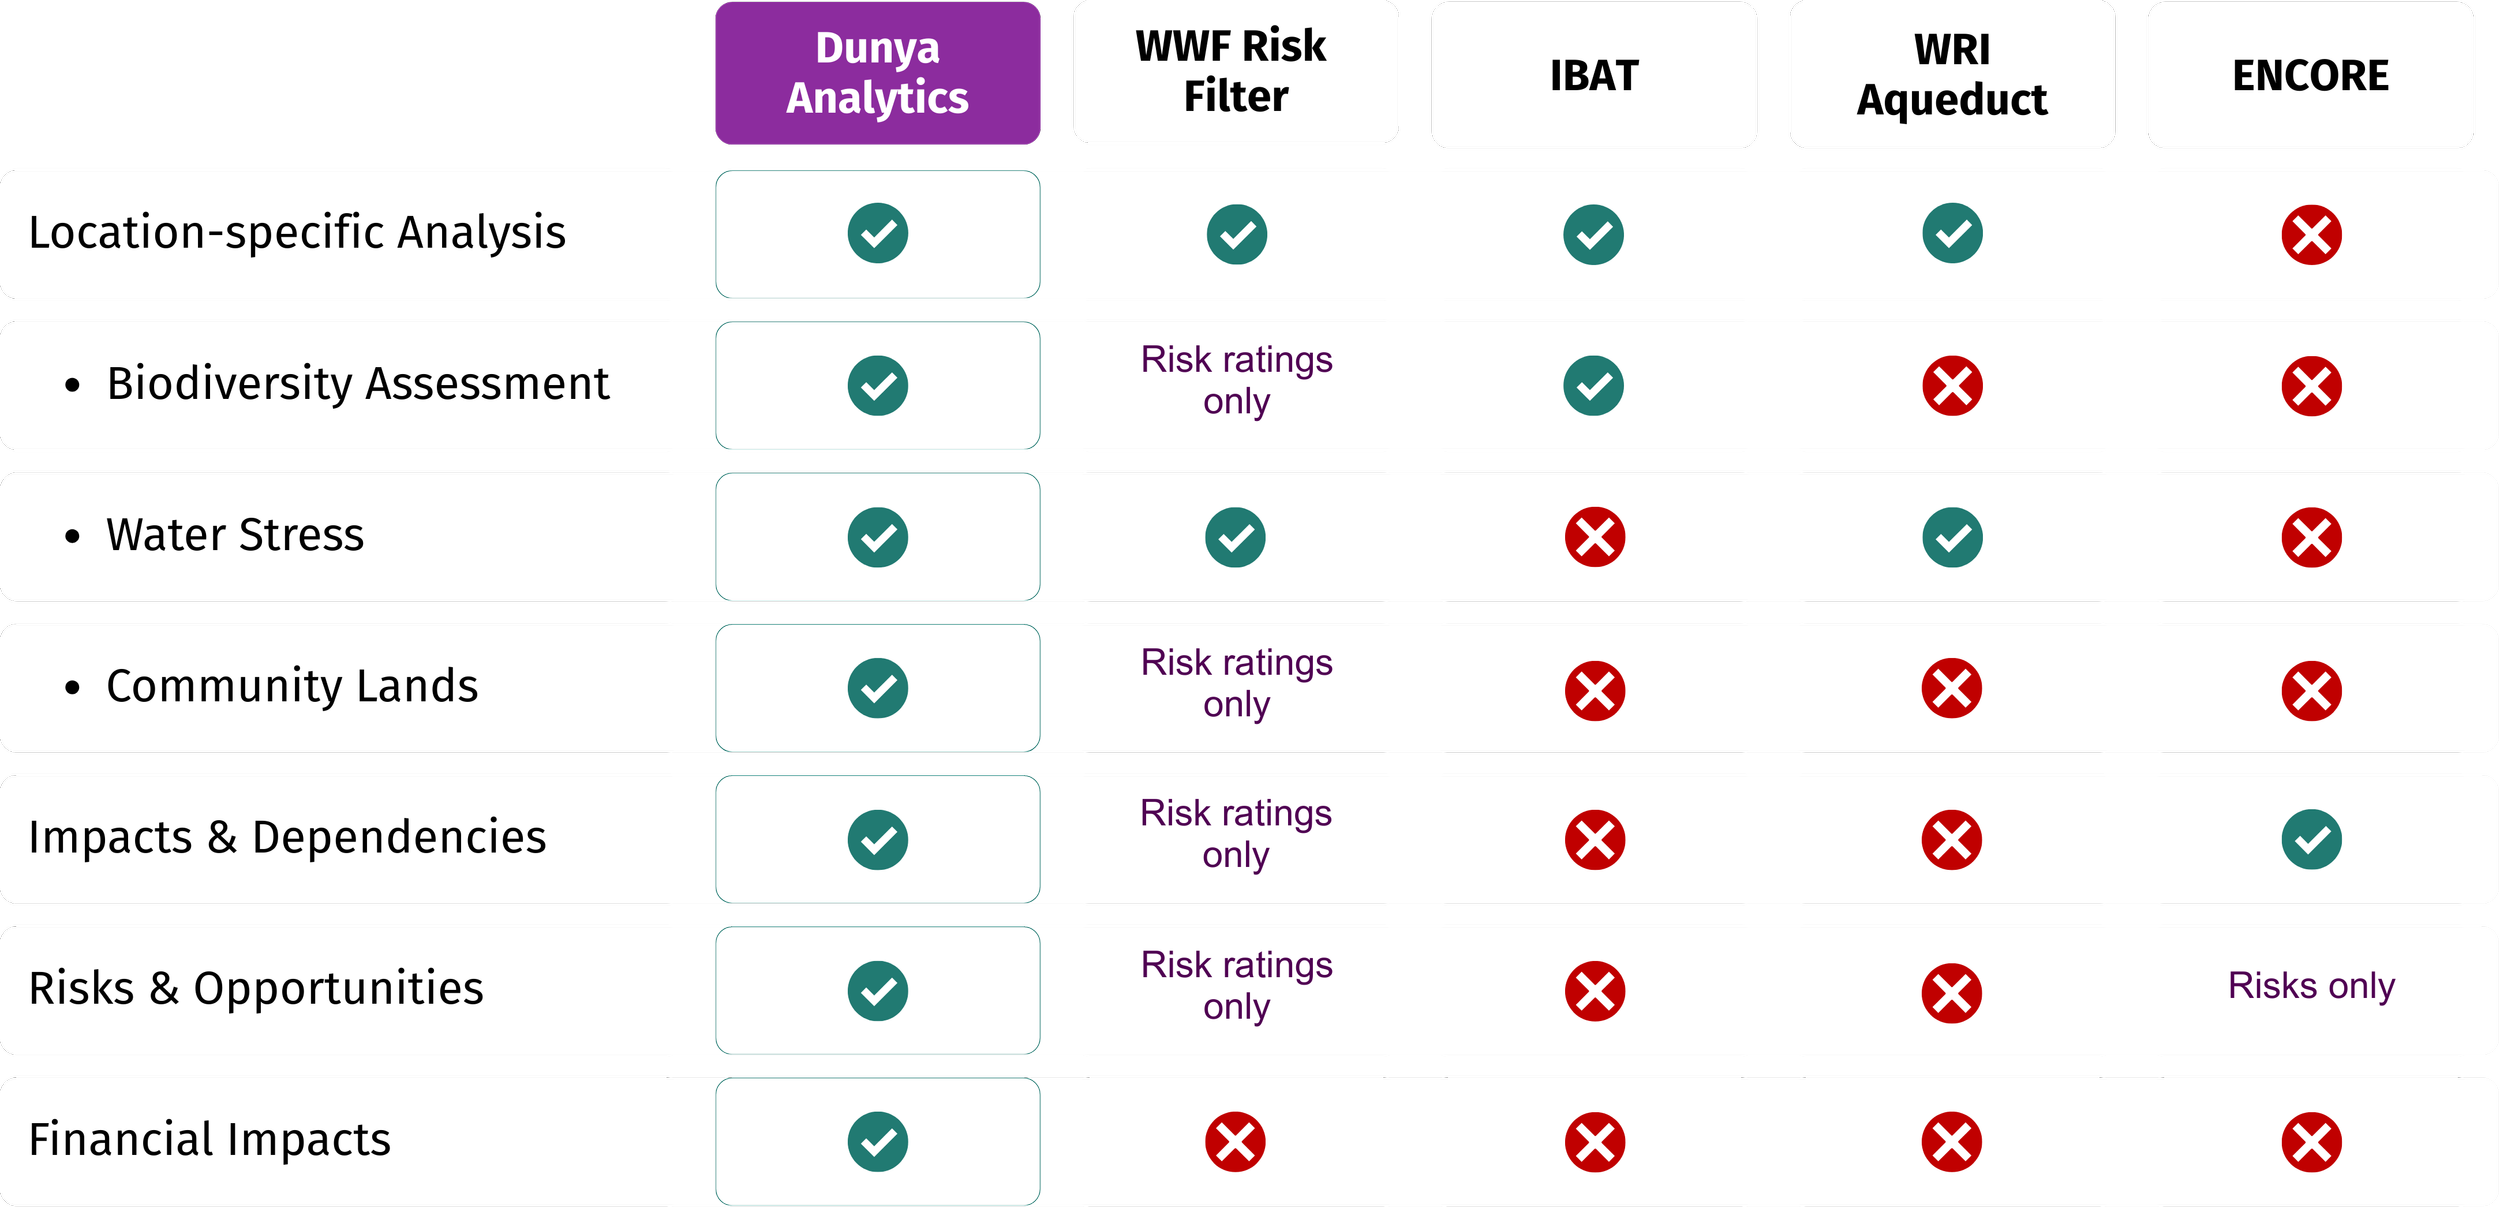
Comprehensive risk analysis in one powerful platform
How we support your disclosures
Locate
In the Locate phase, your company identifies the span of your business model and activities, and discloses the locations of assets or activities in proximity to ecologically sensitive areas.| LEAP step | Outputs from Dunya Analytics Platform |
|---|---|
|
L1: Span of the business model and value chain.
What are our organisation’s activities by sector, value chain (including commodities used) and geography? Where are our direct operations? |
By providing the location (address or latitude and longitude) and industrial activity type of each business activity in your direct operations or value chain, you get an instant list of your activities by sector and geography. You can easily organize your business activities according to place in the value chain (direct operations/ upstream/ downstream), product line, geography, or any other classification that’s useful to you. |
|
L2: Dependency and impact screening.
Which of these sectors, value chains and direct operations are associated with potentially moderate and high dependencies and impacts on nature? |
A complete screening of impacts due to ecosystem pressures and dependencies on ecosystem services is automatically provided for every business activity in your direct operations and value chain. We use the most comprehensive data library on dependencies and impacts on nature (the ENCORE dataset). Our risk dashboard allows you to easily filter for only the business locations with moderate and high dependencies and impacts, to help you focus on the sites that may represent the greatest risks (and opportunities). |
|
L3: Interface with nature.
Where are the sectors, value chains and direct operations with potentially moderate and high dependencies and impacts located? Which biomes and specific ecosystems do our direct operations, and moderate and high dependency and impact value chains and sectors, interface with? |
By simply uploading the location and type of business activities in your direct operations or value chain, the platform instantly identifies the locations with moderate and high dependencies and impacts, and describes the bioregions and ecosystems in which they are located. |
|
L4: Interface with sensitive locations.
For our organisation’s activities in moderate and high dependency and impact value chains and sectors, which of these are in ecologically sensitive locations? And which of our direct operations are in sensitive locations? |
By providing the location and industrial activity type of each business activity in your direct operations or value chain, you get an instant determination of which are located in ecologically sensitive areas, in line with the TNFD requirements. These include areas of:
You can filter and export results to meet this disclosure requirement. We use the best available data, and our methodologies and decisioning frameworks were developed by leading scientists to ensure scientific rigor and prevent greenwashing. Additionally, on the risk dashboard you can filter on the results to generate reports to support business decision making- for example, to answer questions like:
|
Evaluate
In the Evaluate phase, your company aims to understand your potentially material dependencies and impacts on nature.| LEAP step | Outputs from Dunya Analytics Platform |
|---|---|
|
E1: Identification of environmental assets, ecosystem services and impact drivers.
What are the business processes and activities to be analysed? What environmental assets, ecosystem services and impact drivers are associated with these business processes, activities and assessment locations? E2: Identification of dependencies and impacts. What are our dependencies and impacts on nature? |
A complete screening of impacts due to ecosystem pressures and dependencies on ecosystem services is automatically provided for every business activity in your direct operations and value chain. These results can be calibrated based on your company-specific data, enabling audit-ready results for your company. This enables you to confidently explain all results from the platform. As your company completes additional measures that can decrease impacts to nature, our platform provides a dynamic space for you to record and track these changes over time. |
Assess
In the Assess phase, your company seeks to understand which nature-related risks and opportunities are material and should be disclosed.| LEAP step | Outputs from Dunya Analytics Platform |
|---|---|
|
A1: Risk and opportunity identification.
What are the corresponding risks and opportunities for our organization? |
Our risk dashboard allows you to easily assess the overlap of the Locate and Evaluate results. When analyzing nature, the context of the ecosystem determines the risk. For example, your highest water use location may not be your highest risk location. By analyzing the ecosystem context, you can identify where your water use is (or is perceived to be) competing with communities or important ecosystems under water stress conditions. This exposes the business risk and enables you to prioritize actions and transition plans. |
Prepare
During the Prepare phase, your company addresses the material nature-related issues identified through the LEAP approach and determines both the content and method for disclosing these material issues.| LEAP step | Outputs from Dunya Analytics Platform |
|---|---|
|
P3: Reporting
What will we disclose in line with the TNFD recommended disclosures? |
On our risk dashboard, you can easily filter the results from your business activities to generate reports based on your risk assessment for the TNFD’s recommended disclosures. You can organize and track what you have decided to disclose and can manage your disclosures over time. |
GRI provides the world's most widely used standards for sustainability reporting, enabling organizations to measure, understand and communicate their economic, environmental and social impacts to stakeholders and society. GRI 101 includes biodiversity disclosures.
| GRI Disclosure Requirements | Outputs from Dunya Analytics Platform |
|---|---|
| 101-4-a. explain how it has determined which of its sites and which products and services in its supply chain have the most significant actual and potential impacts on biodiversity. | Our platform automates the biodiversity impacts assessment and provides full transparency into the data and methodologies used to obtain every result. Calibrated results are also easily identified for explanation and audit purposes. This enables you to confidently explain all results from the platform. |
|
101-5-a. report the location and size in hectares of its sites with the most significant impacts on biodiversity 101-5-b. for each site reported under 101-5-a, report whether it is in or near an ecologically sensitive area, the distance to these areas, and whether these are:
|
By providing the location (address or latitude and longitude) and industrial activity type of each business activity in your direct operations or value chain, you get an instant determination of which are located in ecologically sensitive areas, in line with the GRI requirements. Reports can be generated and results data can be exported from the risk dashboard. Additionally you can filter on the results to generate reports to support business decision making- for example, to answer questions like:
|
| 101-5-d. report the products and services in its supply chain with the most significant impacts on biodiversity and the countries or jurisdictions where the activities associated with these products and services take place. | The risk dashboard enables you to easily identify where the greatest impacts are in your value chain. You can filter and export results to meet this disclosure requirement. |
| 101-8-a. for each site reported under 101-5-a, list the ecosystem services and beneficiaries affected or potentially affected by the organization’s activities; |
A complete screening of impacts due to ecosystem pressures and dependencies on ecosystem services is automatically provided for every business activity in your direct operations and value chain. The screening also provides information on business activities in proximity to communities and the resources on which they depend. From the risk dashboard, it is easy to generate this report. |
CDP scores company responses to their integrated sustainability questionnaire on a scale from A to F. Organizations achieving an A are recognized on CDP's A List for exceptional performance.
| CDP Biodiversity Questionnaire | Outputs from Dunya Analytics Platform |
|---|---|
11.4 Does your organization have activities located in or near to areas important for biodiversity in the reporting year? Type of areas important for biodiversity:
|
By simply uploading the location and type of business activities in your direct operations or value chain, the platform instantly identifies and lists areas important for biodiversity. Using the risk dashboard, you can export a report of all business activities and identified areas. |
|
11.4.1. Provide details of your organization’s activities in the reporting year located in or near to areas important for biodiversity. For each of the types described in 11.4, provide: -IUCN classification-Country -Name of the area important for biodiversity -Proximity -Briefly describe your organization’s activities in the reporting year located in or near to the selected area -Indicate whether any of your organization’s activities located in or near to the selected area could negatively affect biodiversity |
In addition to identifying activities in proximity to areas of biodiversity, the platform also provides details about protected areas, including IUCN classification, country, name of the area important for biodiversity, and proximity to your business location. Additionally, because the platform aligns to the TNFD LEAP approach, it also assesses the type of activity and any impact materiality that could negatively affect biodiversity at the area. |